How to Track Your Marketing Performance- From Zero to ROAS to ROMI
Tracking marketing performance is no longer optional for businesses running digital campaigns. Whether you are investing in Google Ads, Meta Ads, SEO, email campaigns, influencer marketing, or offline lead generation, understanding your Marketing ROI (ROMI) and ROAS helps improve profitability and scale campaigns efficiently. In this complete guide, we explain how businesses can move from basic marketing tracking to advanced multi-touch attribution models using tools like GA4, CRM systems, and lead management platforms.
Table Of Contents
- Executive Summary (TL; DR)
- What is the difference between Marketing ROI, ROMI and ROAS? When should we use each of them?
- How Do You Start if you have never tracked the performance of Marketing spends?
- Stage 0: Missing Baseline Data? Start by Bifurcating Marketing Spend
- Stage 1: Funnel Analytics and Conversion Rate Optimization (CRO)
- Stage 2: Calculating Campaign ROAS via Last-Click Attribution
- Stage 3: Advanced Departmental ROMI Models
- Stage 4: Multi-Touch Attribution (MTA) & Data-Driven Models
- Golden Rules for Tracking Performance Marketing
- FAQ’s
Executive Summary: ROAS vs. ROMI and the Marketing Analytics Roadmap
Building on our guide to Mastering Marketing ROI: Tracking Success, this blog deep dives into two critical performance marketing metrics: ROAS (Return on Ad Spend) and ROMI (Return on Marketing Investment). While they sound similar, understanding their structural differences—and knowing exactly when to use each—is vital for scaling your marketing efficiency.
Depending on your current data maturity, this guide provides a graded, step-by-step roadmap to scale your tracking capabilities: moving from basic spend classification to advanced conversion tracking, and ultimately to the holy grail of Multi-Touch Attribution (MTA).
📥 Free Optimization Resource: Accelerate your growth with our Downloadable Excel ROI Tracking Template, designed to help you map your performance data seamlessly.
We also tackle the unique challenges of implementing ROI tracking in non-ecommerce or hybrid B2B environments. Discover how pairing a robust Lead Management CRM (like Pronnel) with web analytics suites (GA4, Amplitude, Mixpanel) builds a foolproof tracking framework. We conclude with the 5 Golden Rules of Performance Marketing Tracking to keep your data lean, accurate, and actionable.
Marketing ROI vs. ROAS vs. ROMI: Key Differences & Formulas
When Should You Use Each Metric?
To accurately balance high-level business strategy with daily tactical campaign optimizations, you must separate your tracking metrics into three categories: Corporate ROI, Departmental ROMI, and Campaign-level ROAS.
1. Traditional Marketing ROI
Originating from classic financial analysis, overall Return on Investment (ROI) evaluates high-level strategic business viability over fixed financial quarters.
2. ROMI (Return on Marketing Investment)
As marketing budgets scaled, companies needed to isolate marketing efficiency from overall operational overhead. ROMI measures the total effectiveness of your entire marketing department vs. its total blended expenses.
Note: "Total Marketing Costs" must be clearly defined across your organization. For true accuracy, include ad spend, agency retainer fees, marketing tool subscriptions, and staff hours.
3. ROAS (Return on Ad Spend)
ROAS measures the pure revenue efficiency of an isolated advertising campaign, ad set, or specific keyword. Use this metric daily to determine which active ad campaigns to scale, pivot, or axe entirely.
The Marketing Performance Analytics Roadmap
Granularly tracking user touchpoints across a complex B2B sales funnel gives you an immediate competitive advantage. However, trying to deploy an advanced attribution model on day one is a recipe for data fatigue, broken pipelines, and analysis paralysis.
In many organizations, marketing spend is oversimplified as a single line item on a profit-and-loss (P&L) statement. This creates dangerous visibility gaps. Our step-by-step Marketing Analytics Maturity Roadmap helps you transition seamlessly from zero tracking to advanced marketing data models.
Stage 0: Missing Baseline Data? Start by Bifurcating Marketing Spend
If you currently lack tracking infrastructure, establish a baseline. Align a cross-functional squad of Marketing, Sales, and Finance stakeholders to categorize your historical outflows into three specific buckets:
- Brand Building: Top-of-funnel equity (e.g., asset creation, PR, signage, website redesigns).
- Lead Generation: Direct response tactical initiatives built for short-term customer acquisition.
- Administrative & Statutory: Mandatory compliance, SaaS tool stacks, and miscellaneous overhead.
This layout isolates your structural overhead from your direct customer acquisition costs. For instance, an upfront website build can artificially inflate your early marketing budget, signaling poor performance when direct response campaigns are operating highly efficiently.
Focus on data trends and comparative period-over-period outliers rather than isolated performance metrics. You can jump-start this step by downloading our Free Budget Tracking Spreadsheet here.
Stage 1: Funnel Analytics and Conversion Rate Optimization (CRO)
Once spends are classified, prioritize tracking structural leakages across your conversion funnel. For purely digital setups, tracking impressions to landing page form fills is straightforward. However, tracking becomes complex when managing multiple lead acquisition sources or handling high-touch offline sales cycles.
Your objective here is granular traceability: linking every incoming lead to its exact source medium, campaign asset, and chosen call-to-action (CTA), visible via a clean reporting dashboard.
While spreadsheets offer a temporary baseline, scaling requires an integrated Lead Management System or CRM like Pronnel. A centralized CRM instantly resolves pipeline visibility issues, allowing you to run continuous Conversion Rate Optimization (CRO) programs alongside clickstream tracking suites like Google Analytics 4 (GA4), Mixpanel, or Amplitude.
Stage 2: Calculating Campaign ROAS via Last-Click Attribution
For fast-moving execution teams, launching directly into deep corporate ROMI models can be counterproductive. Start smaller by measuring single-channel campaign efficiency using Last-Click Attribution (where the final marketing interaction receives 100% credit for the financial conversion).
Though last-interaction attribution leaves clear data gaps—such as ignoring early-stage multi-touch lead nurturing sequences (as documented in Garry Lee’s foundational study, "Death of Last Click Wins: Media Attribution and the Expanding Use of Media Data")—it remains an actionable baseline framework for tracking ad platform efficiency.
At this milestone, manual spreadsheets fall short. You need a centralized CRM to programmatically ingest live leads, clean duplicate tracking tags, and route data directly into structured sales pipelines. To set this up:
- Unify your cross-functional Sales, Marketing, and Finance workflows.
- Map absolute transactional revenue to unique tracking values (such as a
utm_idor campaign parameter). - Juxtapose your direct digital ad platform invoices against your captured pipeline revenue.
Using a dynamic CRM to process conversions gives you a distinct advantage: it tracks offline contract sign-offs, delayed B2B wire transfers, and long-term recurring SaaS subscription upgrades that web analytics platforms miss entirely.
Stage 3: Advanced Departmental ROMI Models
Ready to level up your reporting? Upgrade from simple campaign-level ad efficiency (ROAS) to full organizational ROMI. Here, we calculate blended costs like creative asset design, content production wages, subscription software stacks, and mid-funnel lead nurturing touchpoints.
Even if you operate an e-commerce model, tracking blended ROMI requires a dedicated CRM architecture, as standard web storefront tracking packages cannot ingest off-platform internal operational overhead.
First, calculate and map your indirect marketing operations costs across individual organic channels or core landing assets:
Next, integrate direct field sales costs. While classic marketing purists sometimes exclude bottom-of-funnel sales interaction costs from ROMI formulas, high-ticket industries with extended sales cycles must track this metric to locate pipeline inefficiencies.
Collaborate with accounting to define the exact personnel overhead, travel expenses, and collateral outlays required to advance prospects through individual deal stages:
By blending these operational data sets, your engineering and accounting squads can assign accurate, fully loaded cost profiles to individual target leads:
Finally, aggregate these figures to reveal your true ROMI efficiency across your primary organic acquisition networks:
Analyze these blended metrics through four core strategic lenses:
- Macro Trends: Current month blended ROMI compared to historical baseline quarters.
- Structural Medium Splits: Performance comparisons across Paid Social, Organic Search, Influencer Networks, and Event footprints.
- Granular Channel Drill-downs: Platform-specific analysis across Facebook, LinkedIn, TikTok, and Google Search Ads.
- Campaign Specifics: Granular performance checks on isolated seasonal campaign pushes.
Stage 4: Multi-Touch Attribution (MTA) & Data-Driven Models
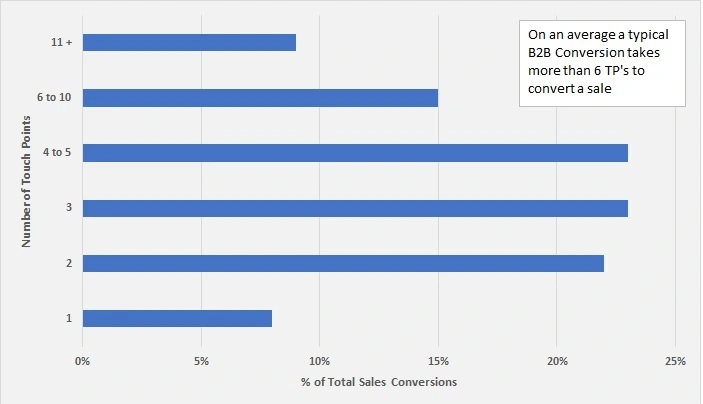
Modern B2B conversion funnels typically require multiple distinct brand touchpoints before a lead converts to a sale. Using a rigid first- or last-click attribution model risks underestimating critical mid-funnel content paths or high-intent discovery channels. However, before investing in advanced Multi-Touch Attribution (MTA) frameworks, consider these practical data engineering challenges:
- Offline Environmental Noise: Traditional print, out-of-home (OOH), and word-of-mouth brand impressions defy clean digital tracking, introducing variance into your model.
- The Cookie-Less Future: Evolving web privacy standards, strict browser restrictions, and tracking blocker extensions limit the lifespan of cross-device customer identification paths.
- The ROPO Trend (Research Online, Purchase Offline): Modern consumption data shows that a vast majority of consumers research products online before finalizing their purchases inside physical retail locations (as noted by Retail Dive). This complicates unified user mapping.
For purely digital platforms, rule-based algorithmic solutions like Google Analytics (offering First, Last, Linear, and Time-Decay attribution), Adobe Analytics, Amplitude, and Mixpanel provide workable baseline logic models. For high-volume environments, you can leverage machine learning to activate dynamic Data-Driven Attribution (DDA).
Let's look at an integrated approach using GA4 reporting alongside an enterprise CRM like Pronnel to manage multi-channel data flows:
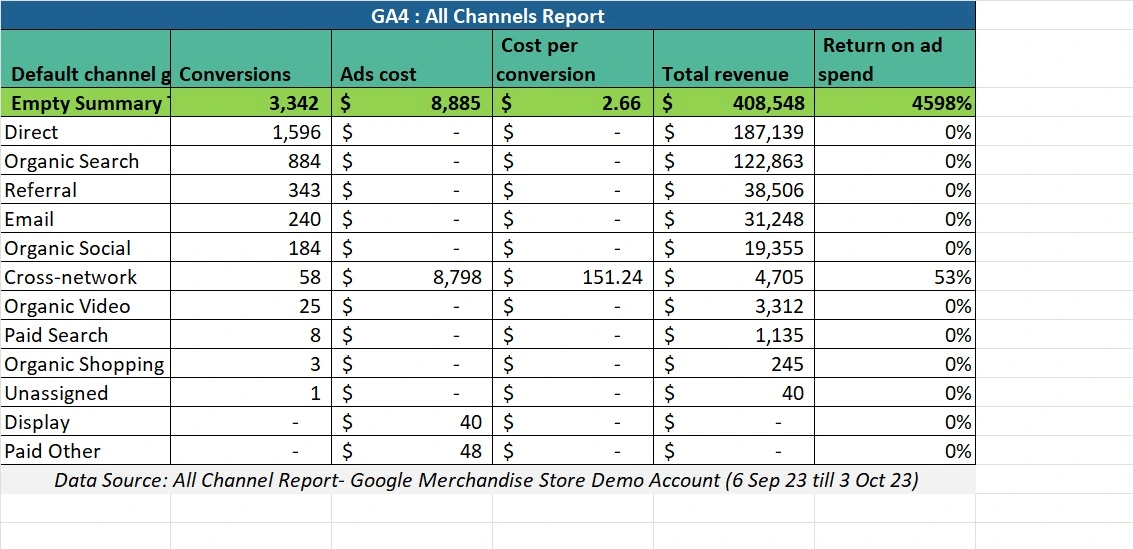
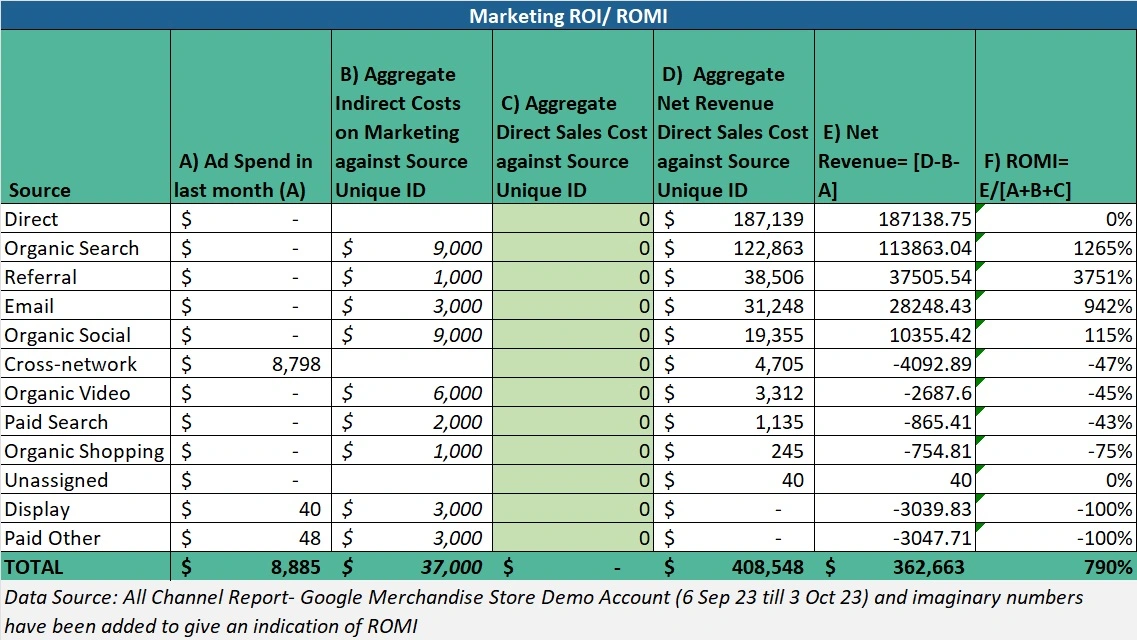
By blending web attribution data with your internal marketing operational costs, you can uncover true performance variations. For instance, a campaign showing a 46x ROAS can normalize to a 7.9x ROMI once you factor in production design retainers, platform licensing fees, and internal labor costs:
Note: This model requires fully digital touchpoint tracking loops. Please check our FAQ section below to see if your web property meets the baseline criteria for Google's Data-Driven Attribution engine.
5 Golden Rules for Successful Performance Marketing Tracking
1. Perform a Strategic Cost-Benefit Analysis
Before building intricate, highly customized data attribution pipelines, evaluate your team's operational maturity. Balance the engineering time required to build and audit these pipelines against the actual revenue optimization they will generate.
2. Maintain Cross-Departmental Alignment
Build your tracking logic collaboratively across Sales, Finance, and Marketing. This prevents siloed reporting and ensures your entire organization uses consistent, agreed-upon definitions for cost classification and revenue attribution.
3. Start Small and Iterate Systematically
If your organization lacks a tracking baseline, do not rush into advanced multi-touch machine learning models. Progress naturally through the analytics roadmap: stabilize at Stage 0, implement clean conversion tracking, optimize your immediate campaign ROAS, and then build toward fully loaded ROMI models.
4. Focus on Data Outliers
Do not let massive data sets obscure actionable insights. Isolate unexpected performance spikes or deep conversion drops to uncover systemic funnel issues or high-performing tactical variations.
5. Continuously Refine and Audit Your Logic
Consumer behavior patterns, tracking technologies, and industry compliance standards shift constantly. Re-evaluate and recalibrate your internal tracking models periodically to identify and correct emerging data gaps.
In the next part of our series, we will unpack the changing media landscape, dive deep into advanced lead capture tactics, and explore real-world solutions for mapping hybrid online/offline user journeys. We will also audit the latest tracking frameworks across GA4 and look at how changing privacy regulations shape modern customer acquisition.
Frequently Asked Questions About Frequently Asked Questions About Creating Board
What is Marketing ROI?
Marketing ROI (Return on Marketing Investment) measures how much revenue your business generates compared to the total marketing cost spent on campaigns, advertising, tools, and resources.
What is the difference between ROAS and ROMI?
ROAS measures revenue generated directly from advertising spend, while ROMI measures the overall profitability of marketing efforts including ad spend, tools, employee costs, and campaign expenses.
Why is tracking Marketing ROI important?
Tracking Marketing ROI helps businesses understand which campaigns generate profit, optimize marketing budgets, improve lead quality, reduce acquisition costs, and scale high-performing channels.
Can small businesses track Marketing ROI?
Yes. Small businesses can start by tracking leads, conversions, ad spend, and campaign revenue using tools like Google Analytics, CRM software, spreadsheets, and marketing dashboards.
Why do businesses need a CRM for Marketing ROI tracking?
CRM software helps businesses track leads across multiple channels, monitor offline conversions, manage customer journeys, and calculate accurate Marketing ROI beyond basic analytics tools.
What is the best attribution model for Marketing ROI?
The best attribution model depends on your business type, sales cycle, and customer journey. Businesses often start with Last Click Attribution and gradually move toward Multi-Touch Attribution or Data Driven Attribution models.
What is Multi-Touch Attribution in marketing?
Multi-Touch Attribution assigns conversion credit across multiple customer touchpoints such as ads, emails, social media, SEO, and website visits instead of attributing all value to a single interaction.
How does Google Analytics help track Marketing ROI?
Google Analytics helps businesses track traffic sources, user behavior, conversions, campaign performance, and attribution paths to measure marketing effectiveness and optimize campaigns.
What is Data Driven Attribution (DDA) in GA4?
Data Driven Attribution in GA4 uses machine learning to distribute conversion credit across different customer interactions based on actual conversion data and user behavior patterns.
Can Marketing ROI be tracked for offline sales?
Yes. Businesses can track offline sales using CRM systems, lead management software, call tracking, coupon codes, sales pipelines, and customer source attribution methods.
What is a good Marketing ROI benchmark?
A Marketing ROI ratio of 5:1 is generally considered strong, while high-growth companies may operate at lower ratios during expansion phases. Ideal ROI benchmarks vary by industry and business model.
What are the common mistakes while tracking Marketing ROI?
Common mistakes include ignoring offline conversions, relying only on Last Click Attribution, not tracking customer lifetime value, poor CRM integration, and incomplete campaign tracking.
Can Pronnel CRM help track Marketing ROI?
Yes. Pronnel CRM helps businesses track leads, customer journeys, sales funnels, conversions, campaign performance, and marketing attribution from a centralized dashboard.
Conclusion
Tracking Marketing ROI, ROAS, and ROMI is essential for businesses looking to improve campaign performance, reduce customer acquisition costs, and scale revenue efficiently.
Whether you are a startup, ecommerce business, B2B company, or enterprise brand, building a structured marketing attribution and conversion tracking system helps you understand which channels generate the highest returns.
Using tools like Google Analytics 4 (GA4), CRM software, lead management systems, and multi-touch attribution models can help businesses gain deeper visibility into customer journeys and marketing performance.
Pronnel CRM helps businesses centralize lead tracking, sales pipeline management, customer interactions, campaign attribution, and conversion analytics from a single platform.
Subscribe To Pronnel Blogs
Get the latest updates on AI CRM software, WhatsApp automation, business productivity, customer engagement, and workflow automation directly to your inbox.