Using Formula for Smarter Data Insights
Pronnel's Formula feature lets you perform quick, no-code calculations directly within your board columns—such as counting entries, identifying empty or filled fields, calculating percentages, or detecting unique values. Whether you're tracking lead conversion rates, project progress, or survey responses, Formulas help you unlock valuable insights in seconds—without the need to export data or write code. Ideal for teams across sales, operations, or analysis, you can set up custom logic right inside the column settings and start making smarter decisions, faster.
Formula: Automate Column Calculations
Use Formula to turn raw board data into actionable insights with a few clicks. Track progress, data completeness, or participation by summarizing your data across multiple columns.
For most columns, formulas include:
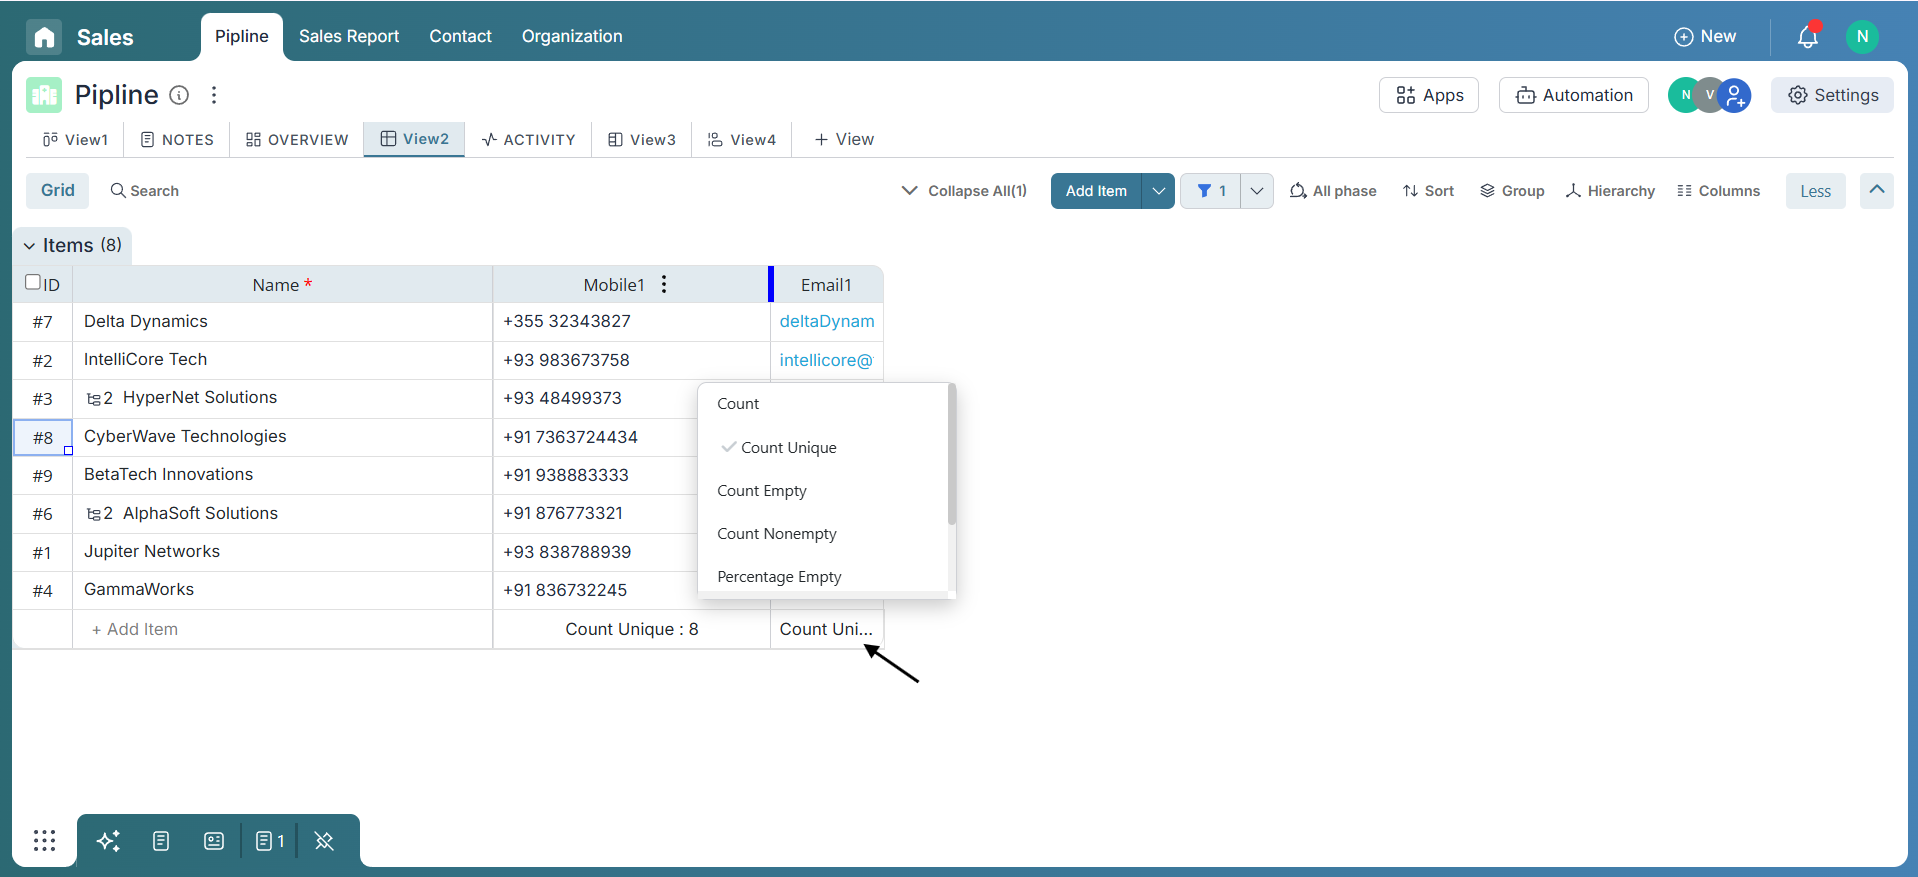
- Count – Total number of entries
- Count Unique – Shows only unique values
- Count Empty / Nonempty – Identifies missing or filled values
- Percentage Empty / Nonempty – Offers a quick health check of your data
- None – Clears any applied formula
For number columns, additional options are:
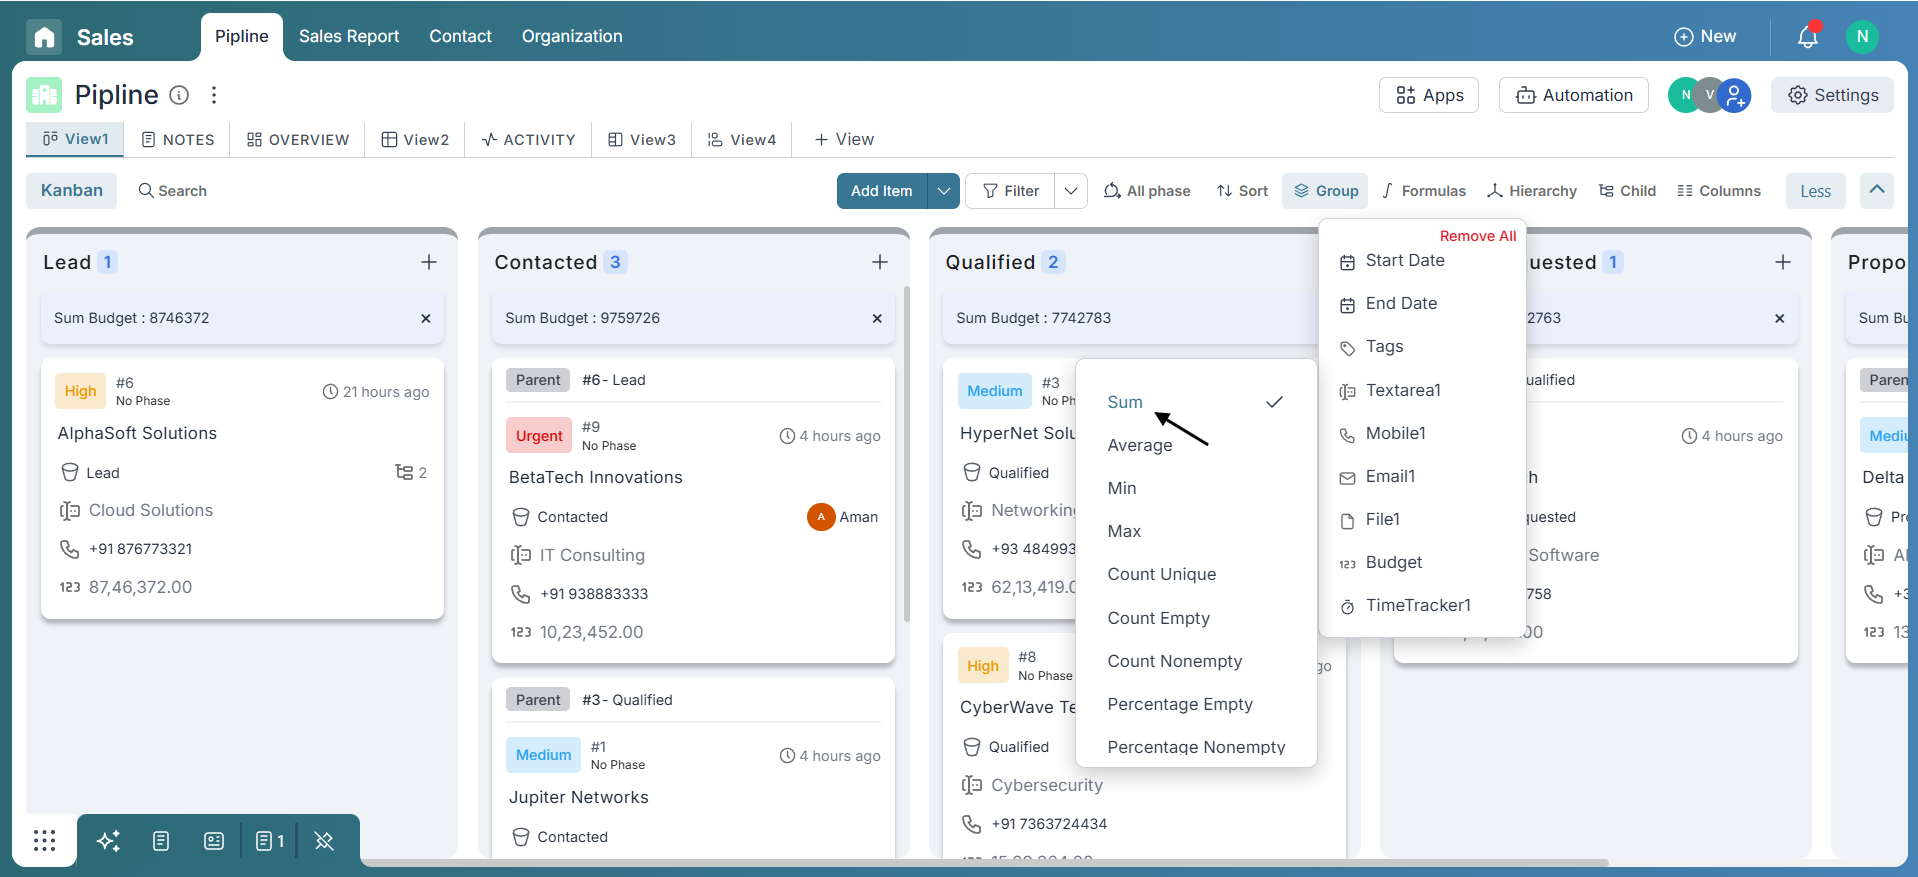
- Sum – Adds all numeric values
- Average – Calculates the mean value
- Min / Max – Finds smallest or largest value
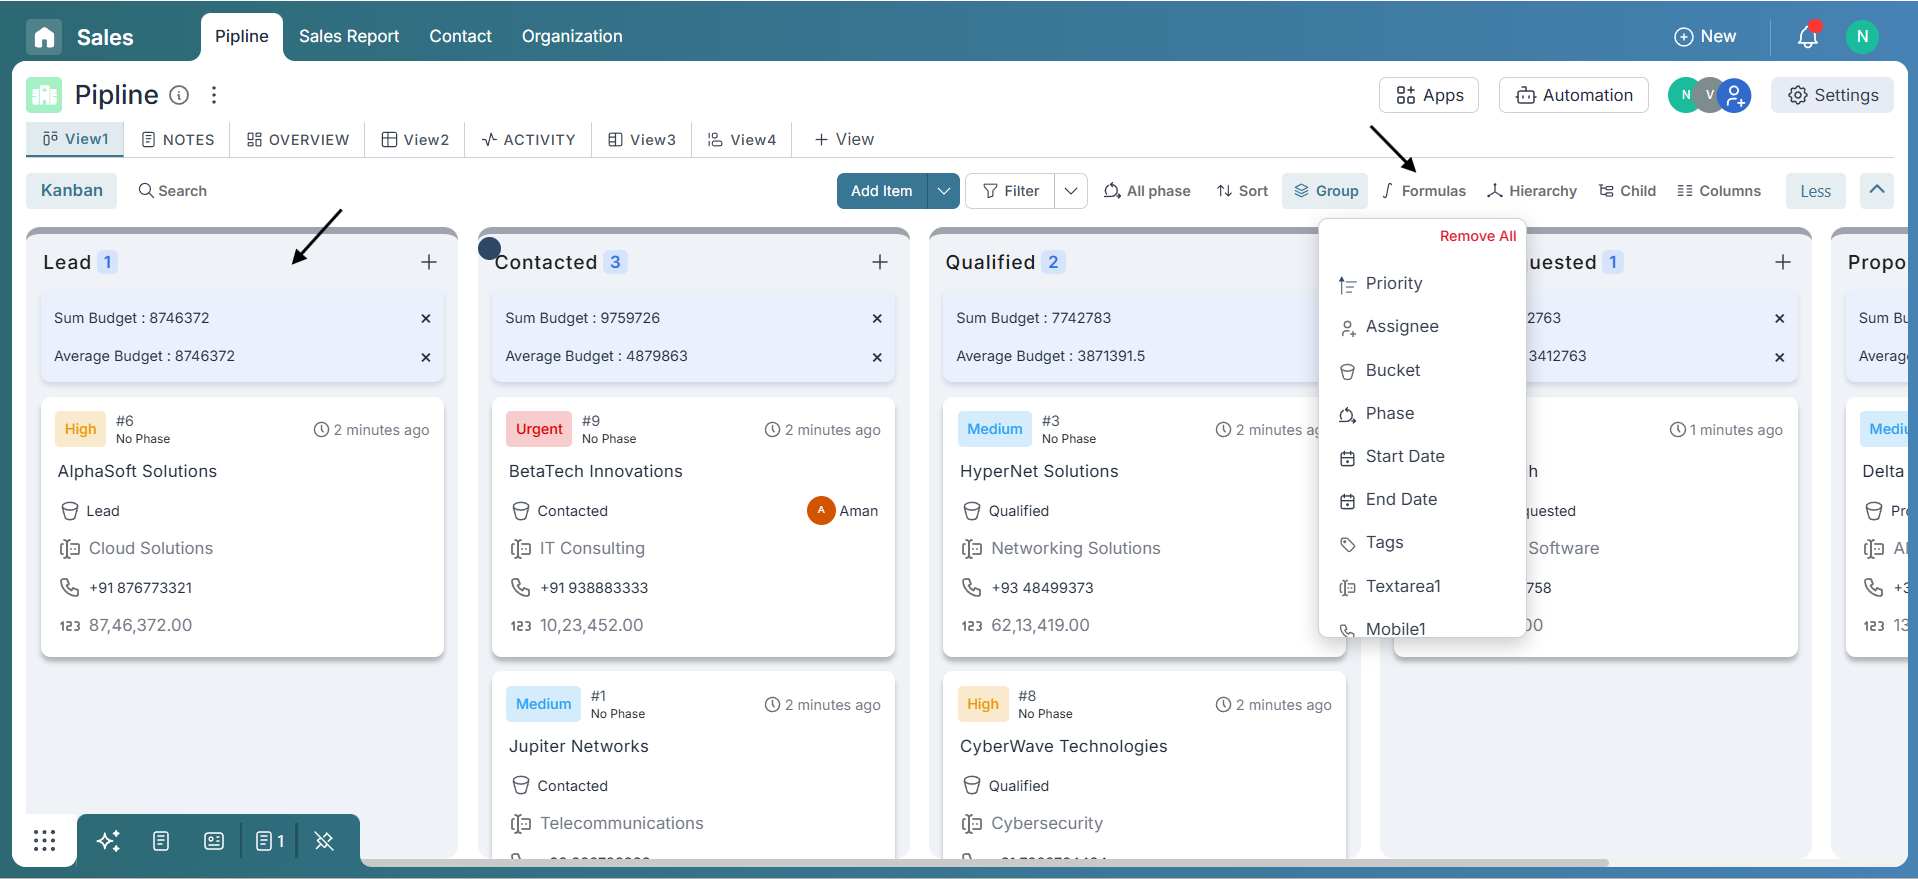
To apply a formula, click the “Formula” button in the column header, then select the columns and formula type from the dropdown. You can apply formulas to multiple columns at once for bulk data insights.
In Kanban view, formula results appear at the top of each group and update dynamically as data changes.
In Grid view, formulas appear at the bottom of the column. Just click the last cell of the column and select your formula. The process is similar in Gantt view.
Best Practices
- Use Count and Percentage to keep tabs on project progress or workload distribution.
- Apply Count Unique to spot distinct assignees, tags, or entry types.
- Apply formulas across multiple columns for a bird’s-eye view of board activity.
- Regularly review summary values to stay ahead of data inconsistencies.
Conclusion
With Pronnel’s Formula feature, you gain immediate, actionable insights—no exports, no external tools. It simplifies reporting, boosts clarity, and keeps your team focused on what matters most. Think of it as your in-board data assistant.
Frequently Asked Questions About Formulas in Pronnel
Can I apply formulas to any column?
Formulas work for structured types like text, numbers, dropdowns, and people. Some types may not support summaries.
Do formula values update automatically?
Yes. Summaries refresh instantly as data changes.
Can I apply multiple formulas to the same column?
Yes. Switch between Count, Percentage, Unique, Sum, etc., per view/need.
Do formulas affect sorting or filtering?
No. They are visual summaries only; data and filters remain unchanged.
Can I export formula results?
Not directly; export base data to reproduce results externally.