Using Gantt View in Pronnel for Effective Project Timeline Management
The Gantt View in Pronnel is a powerful visualization tool that helps project managers and team leads plan, monitor, and manage task timelines effectively. It provides a bird’s-eye view of task dependencies, timelines, and progress across your project boards.
In this tutorial, we will walk through how to access, customize, and utilize the Gantt View in Pronnel to stay on top of your project schedules and phase-wise progress.
Step 1: Accessing the Gantt View
-
Go to Your Project Board:
Log in to your Pronnel account and open the project board where you want to view tasks in Gantt format.
-
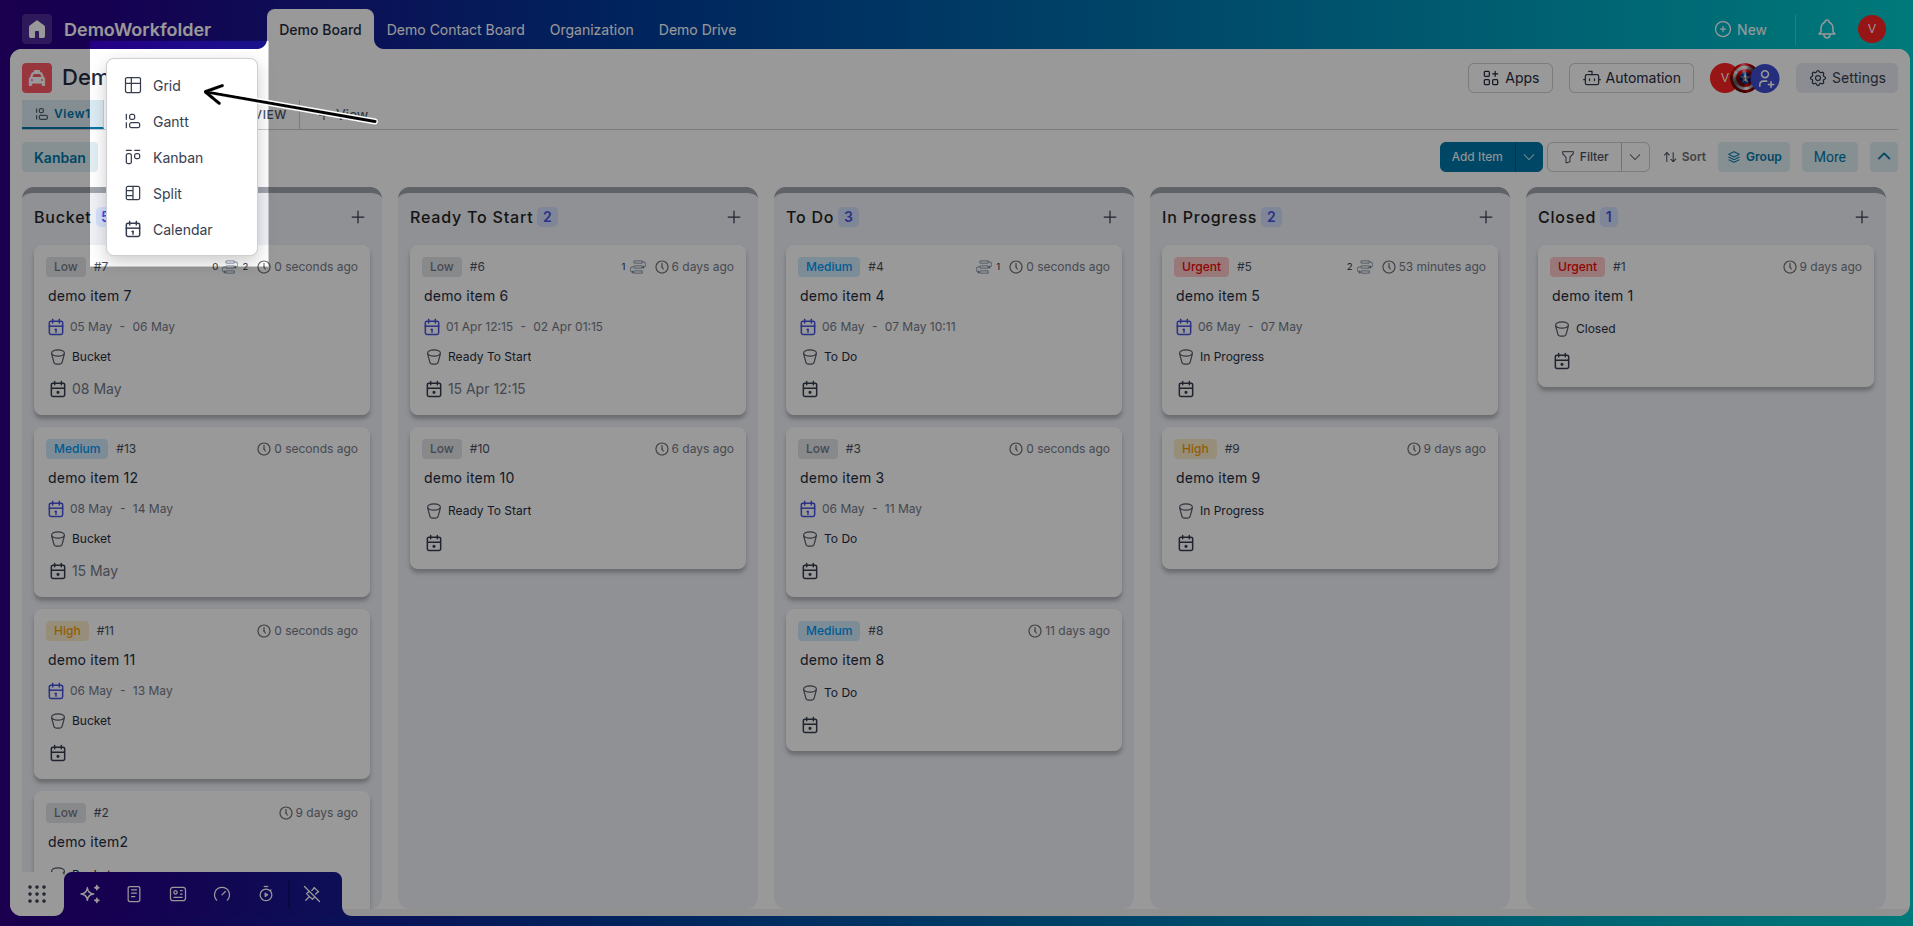
Select the Gantt View:
In the board’s view selector, click on “Gantt” to switch to the Gantt chart interface.
Step 2: Understanding the Gantt Layout
-
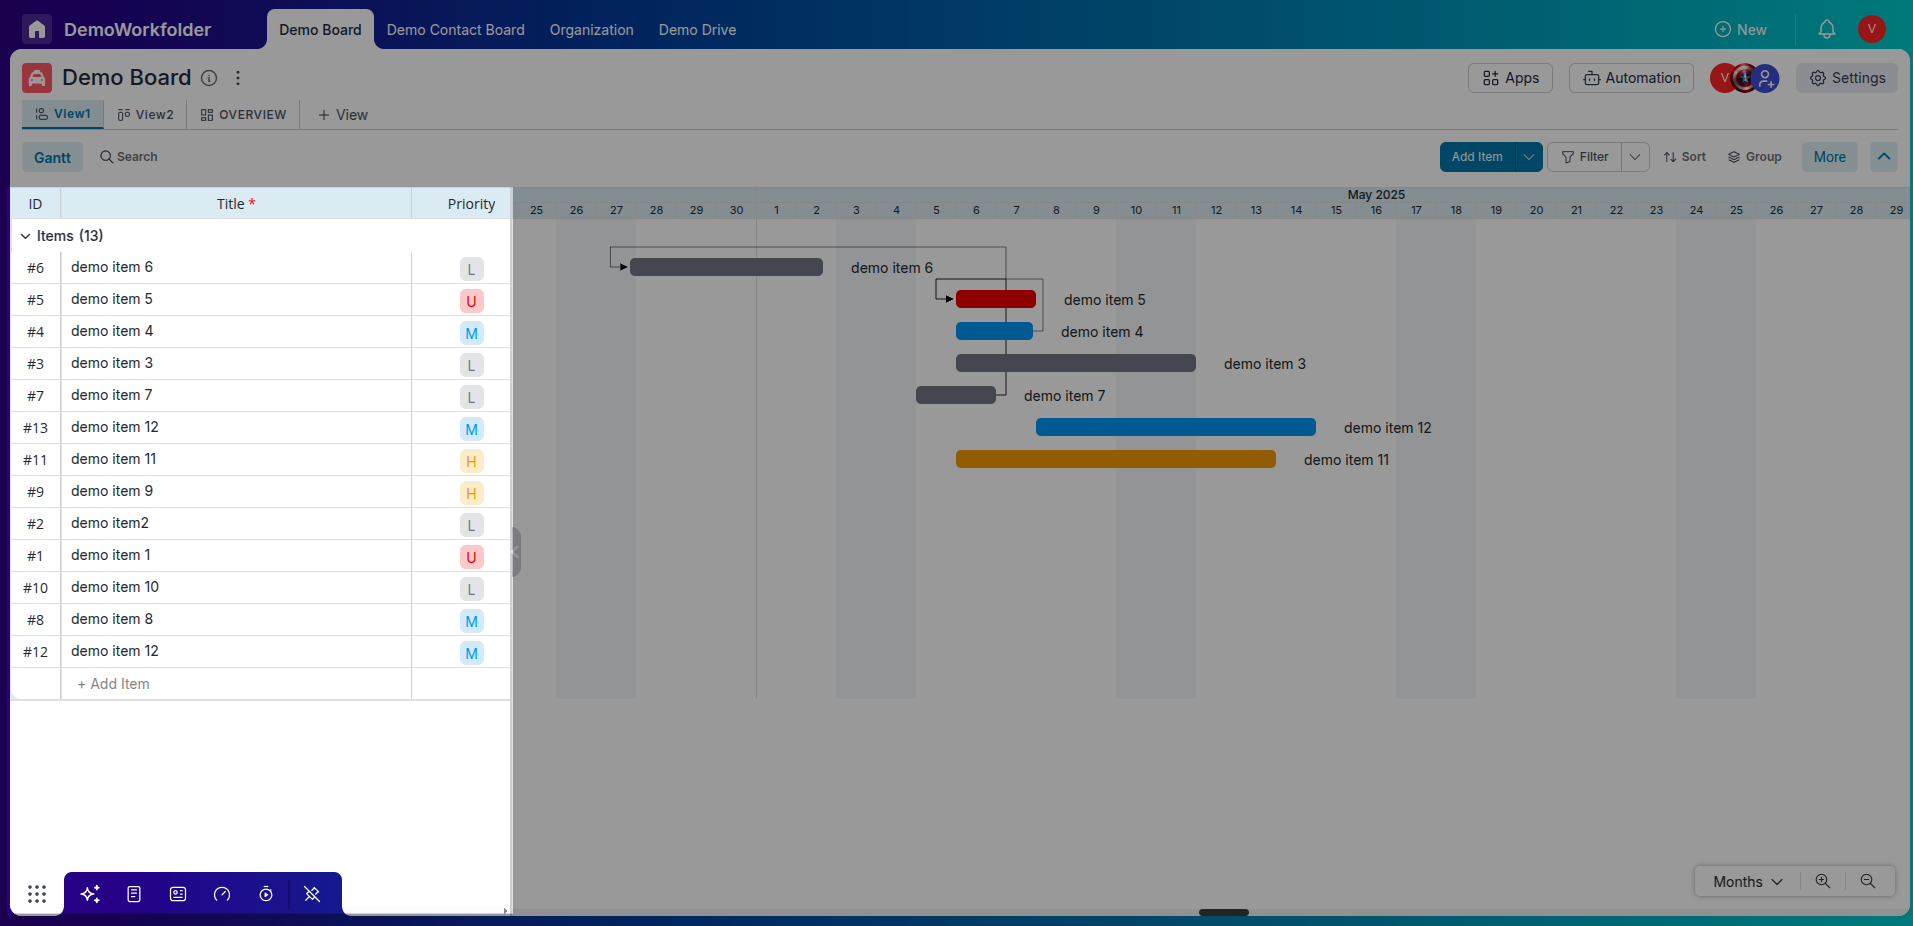
Left Panel (Task Information):
Displays task title, start and end dates, priority, tags, assignees, and status (bucket-wise).
-
Right Panel (Gantt Chart):
Visualizes each task as a horizontal bar spanning from start to end date. You can drag-and-drop bars to adjust timelines directly.
Step 3: Customizing the Gantt View
-
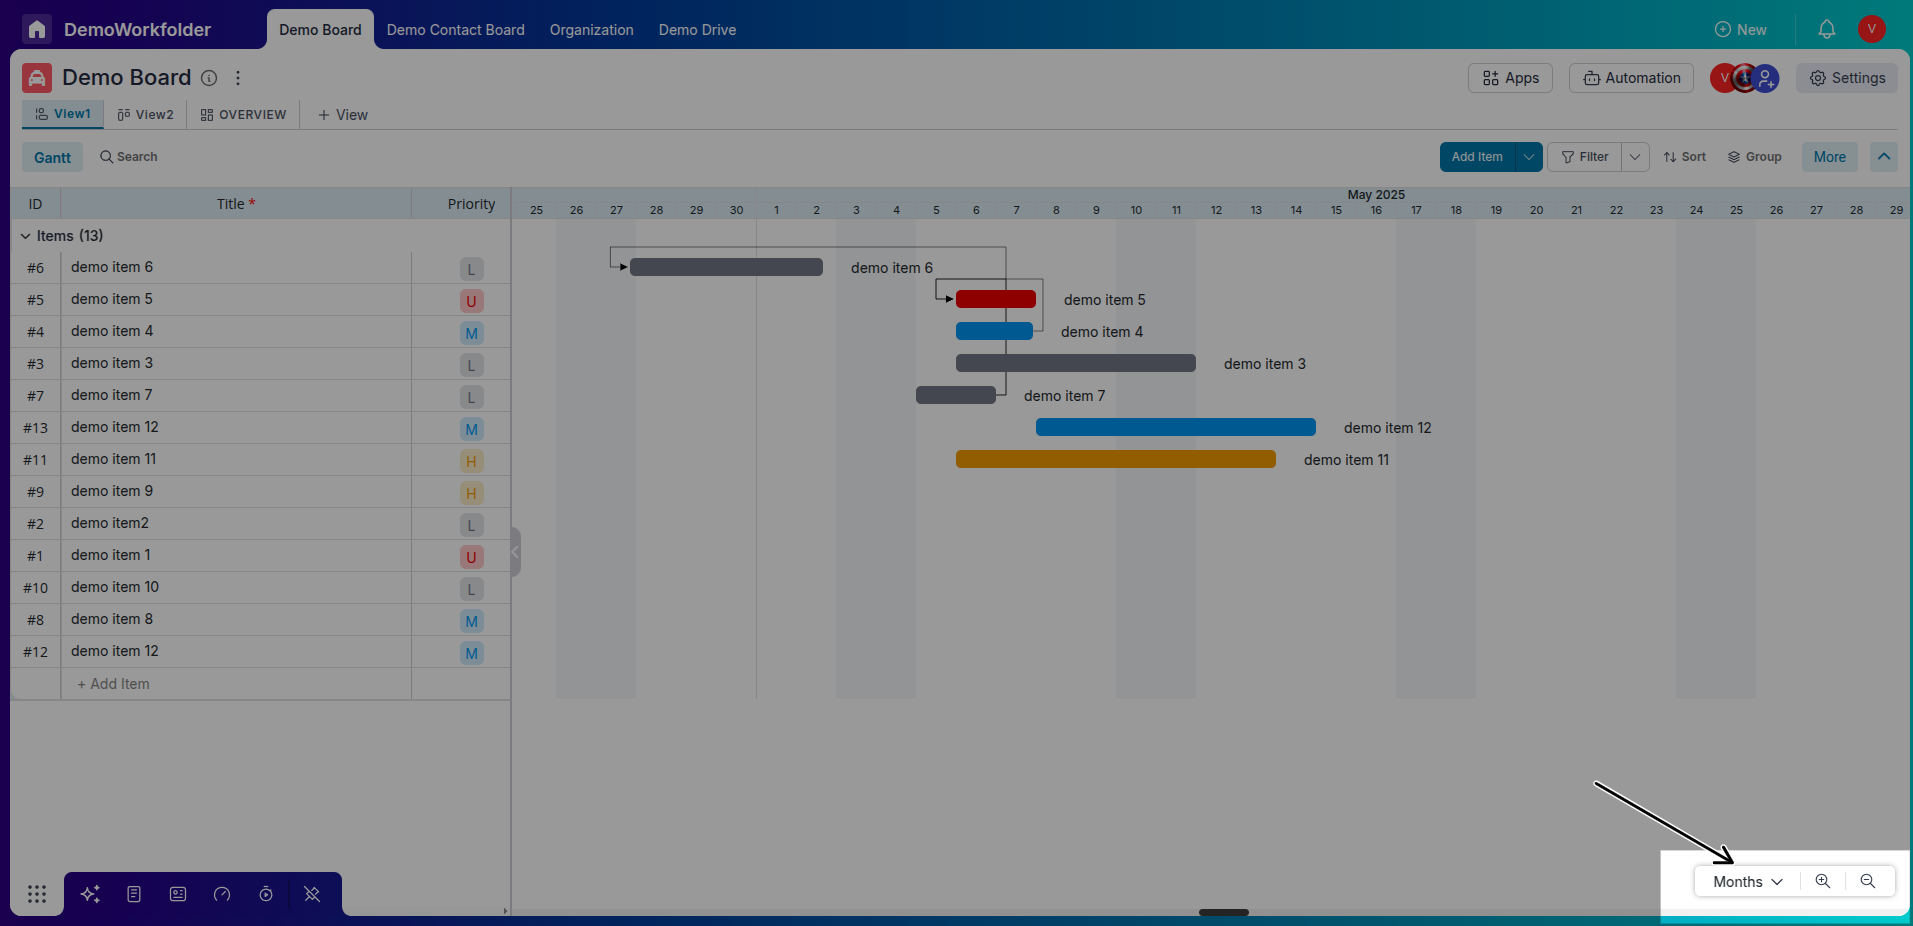
Time Interval Options:
Switch between Day, Week, or Month views depending on the level of granularity you need.
-
Resize Panels:
Use the horizontal slider to adjust how much screen space is allocated between the task list and the Gantt chart.
-
Enter Full-Screen Mode:
Click the expand icon to enter full-screen mode for a more immersive project planning experience.
Step 4: Filtering and Sorting Data
-
Apply Filters:
Use the filter options to display only relevant tasks based on tags, buckets, assignees, or other attributes.
-
Sort Tasks:
Sort tasks by start date, end date, or priority to keep your timeline organized.
Step 5: Using Phases in Gantt View
-
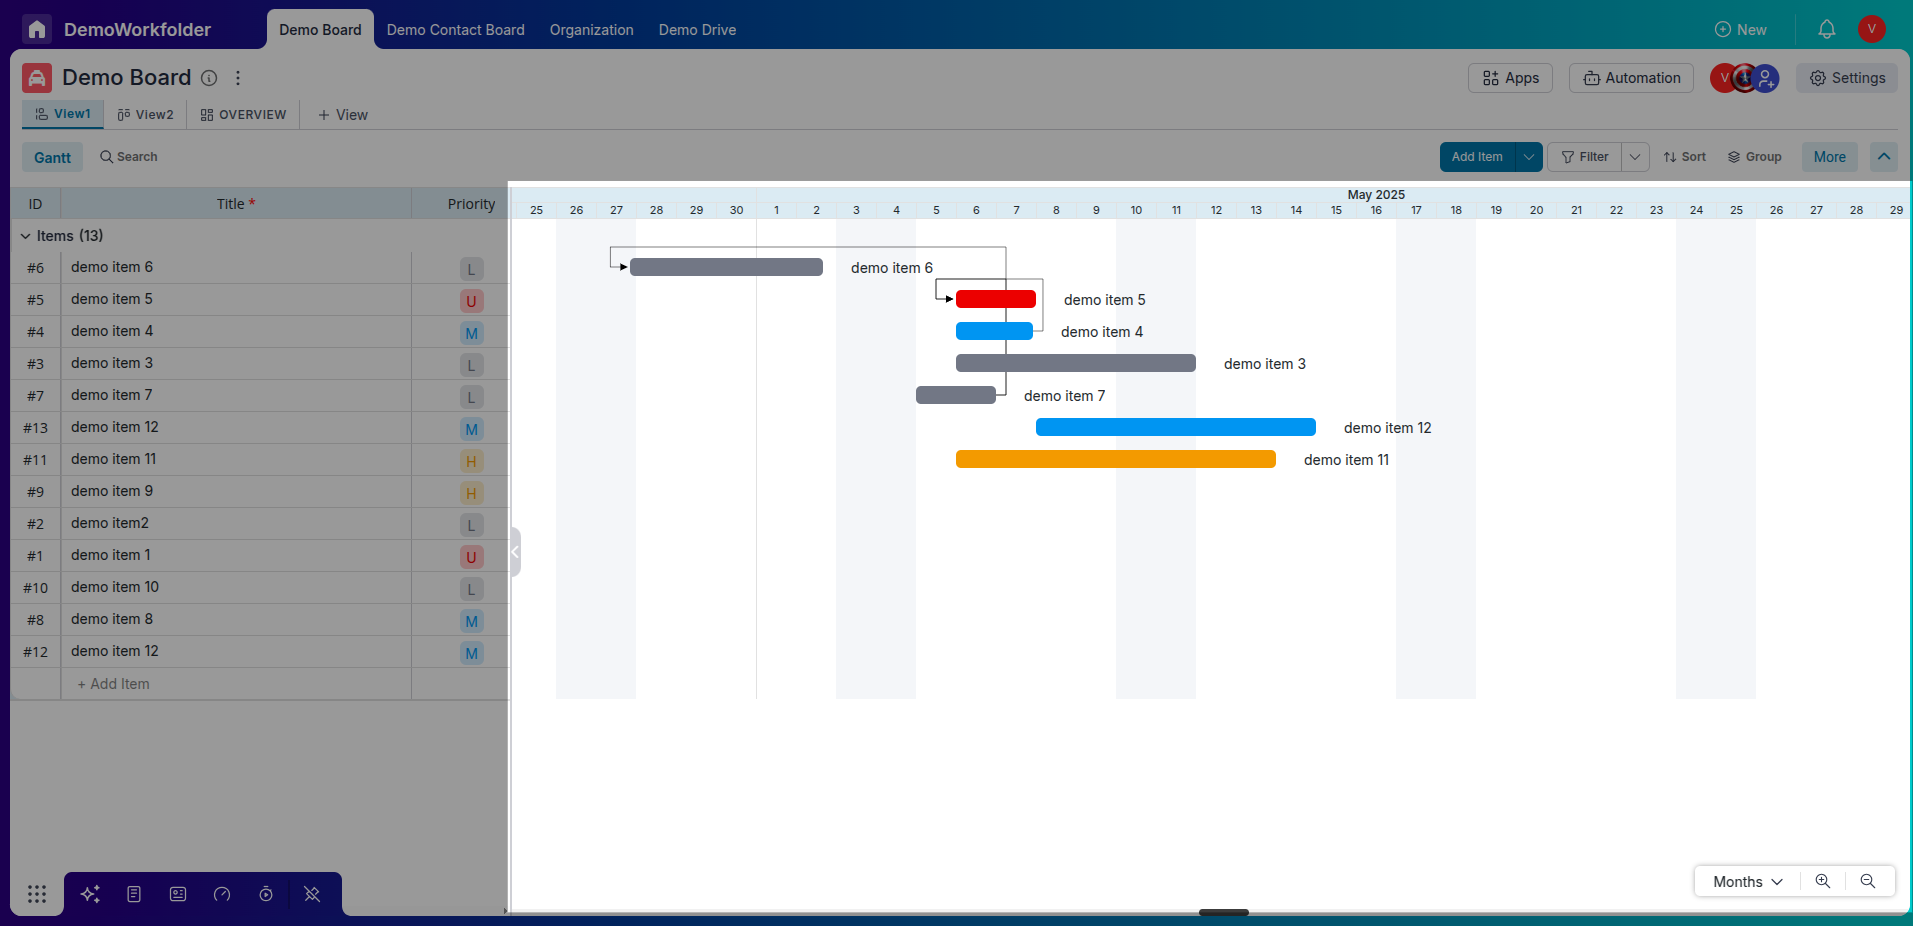
You can also establish relation using arrow in Gantt View
In the Gantt View, you can define task dependencies by clicking and dragging an arrow from one task bar to another. This visually connects tasks, indicating that one must start or finish before the other can proceed. These arrows help represent the sequence and interdependence of tasks in your project timeline.
Conclusion:
Gantt View in Pronnel equips you with everything you need to plan and execute projects on schedule. Whether you’re managing a single sprint or a complex multi-phase project, the interactive Gantt chart allows you to visualize dependencies, make real-time adjustments, and keep the entire team aligned. Explore the customization, filtering, and full-screen capabilities to make the most of this powerful feature.
Frequently Asked Questions About Gantt View in Pronnel
How do I enable Gantt View?
Use the board view selector to choose “Gantt”. Admins may publish it; users can also create private Gantt views.
Can I move tasks in the Gantt chart?
Yes. Drag and drop bars to change start/end dates.
What details are shown?
Title, dates, priority, tags, assignees, status, plus a visual timeline.
What zoom options exist?
Switch between Day, Week, or Month scales.
Can I filter tasks?
Yes. Filter by tags, buckets, users, or custom attributes.
Is full-screen mode available?
Yes. Use full-screen for better visibility and adjust panel sizes.
How do Phases appear?
Phases display at the top with grouped tasks below for structure and progress.
Can I sort tasks?
Yes. Sort by start date, end date, or priority.
Does it update automatically?
Yes. Timeline reflects task updates instantly.
Can I show dependencies?
Yes. Draw arrows between tasks to indicate dependencies.