Using Number Charts in Pronnel
Want to visually compare data across categories or stages? Pronnel’s Number Charts are designed to help teams identify trends, breakdowns, and performance metrics. In this tutorial, we’ll walk you through how to create and customize these charts within your Dashboards or Overview Views.
Getting Started
To add a chart, go to your Dashboard or Overview View and click on the Add Widget button. From the options, choose Number.Easy to use and understand, Number Charts are a great way to keep track of key metrics at a glance.
Number Chart: This chart is useful for viewing the distribution of bugs based on a single attribute, such as priority. For example, you can create a Number Chart to quickly understand how many bugs are categorized as High, Medium, or Low priority. This gives your team immediate insight into where the most critical issues are concentrated.
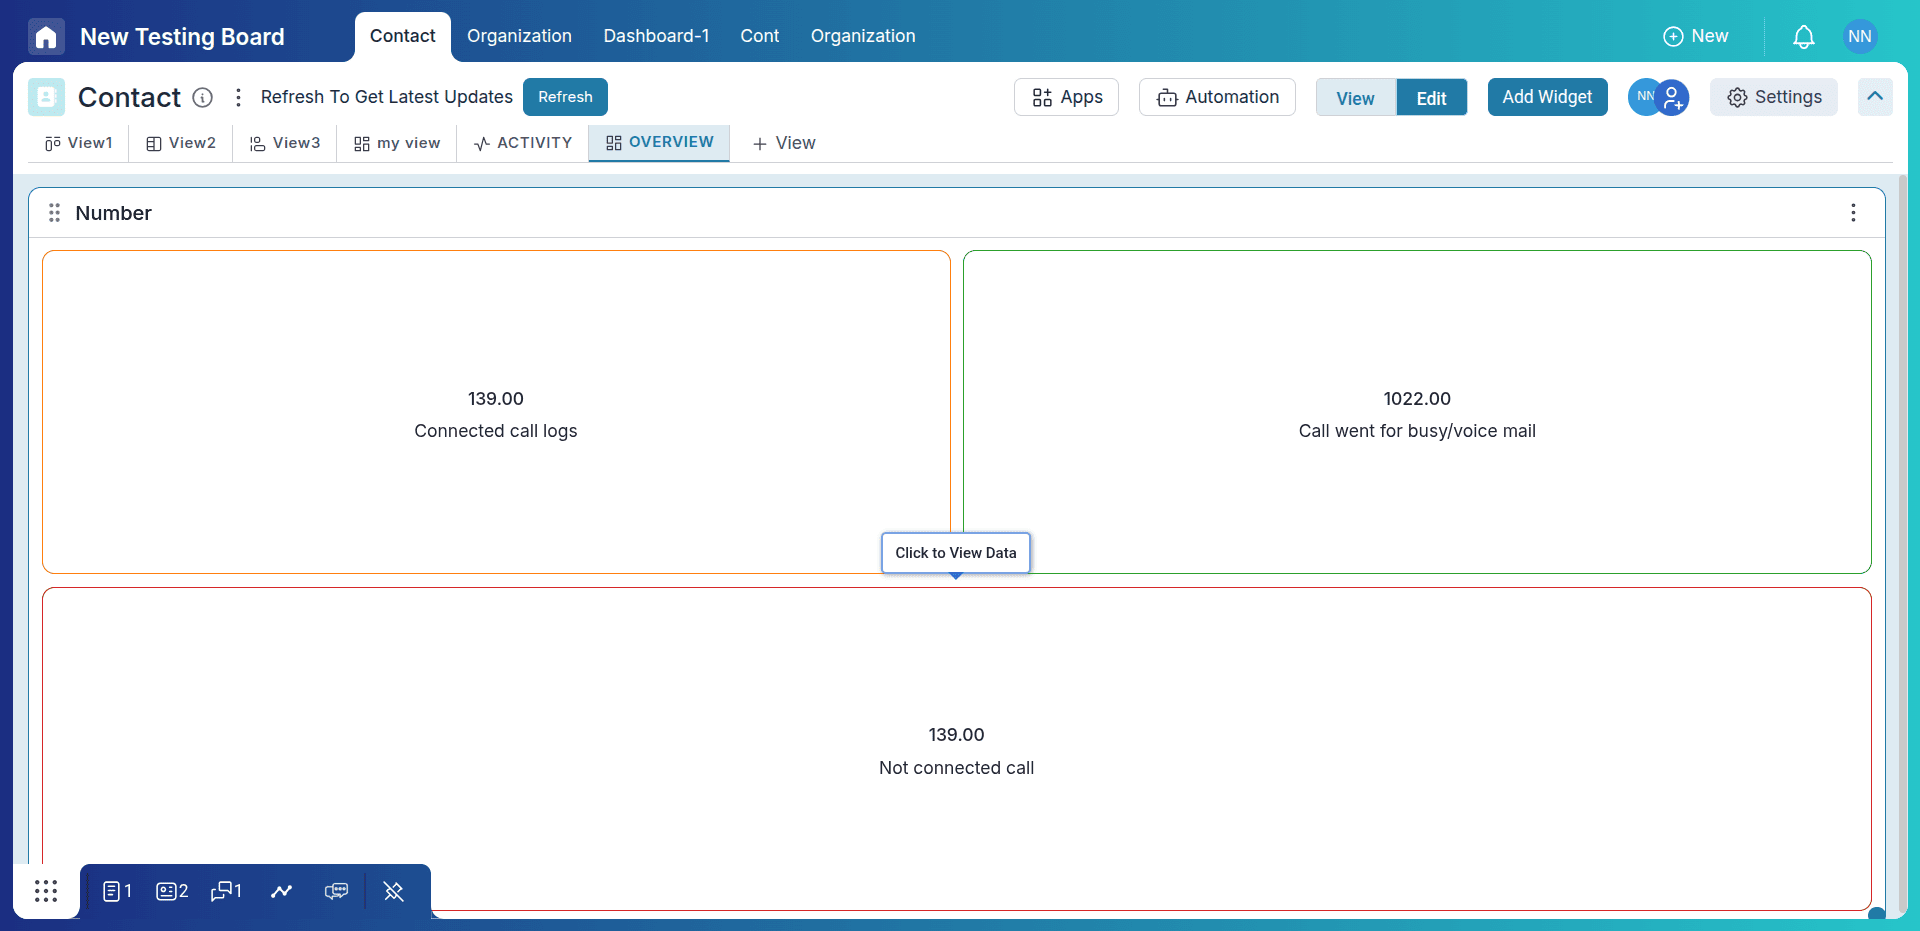
Chart Configuration
Let’s take a simple use case: displaying the total number of leads created and calculating the lead conversion rate using a formula. Number widgets are useful for showing key metrics such as total leads, total closed deals, or conversion percentages.
-
Adding Number / Formula Widget
When you click on Add Widget and select a Number Chart, you will see two options: Number and Formula.
Number: Displays a single metric such as total leads, total deals, or total tasks. It can count items or aggregate numeric values from a board.
Formula: Allows you to calculate values using existing number widgets or board columns. For example, you can calculate a conversion rate = Closed Leads / Total Leads × 100.
-
Configure Number Widget
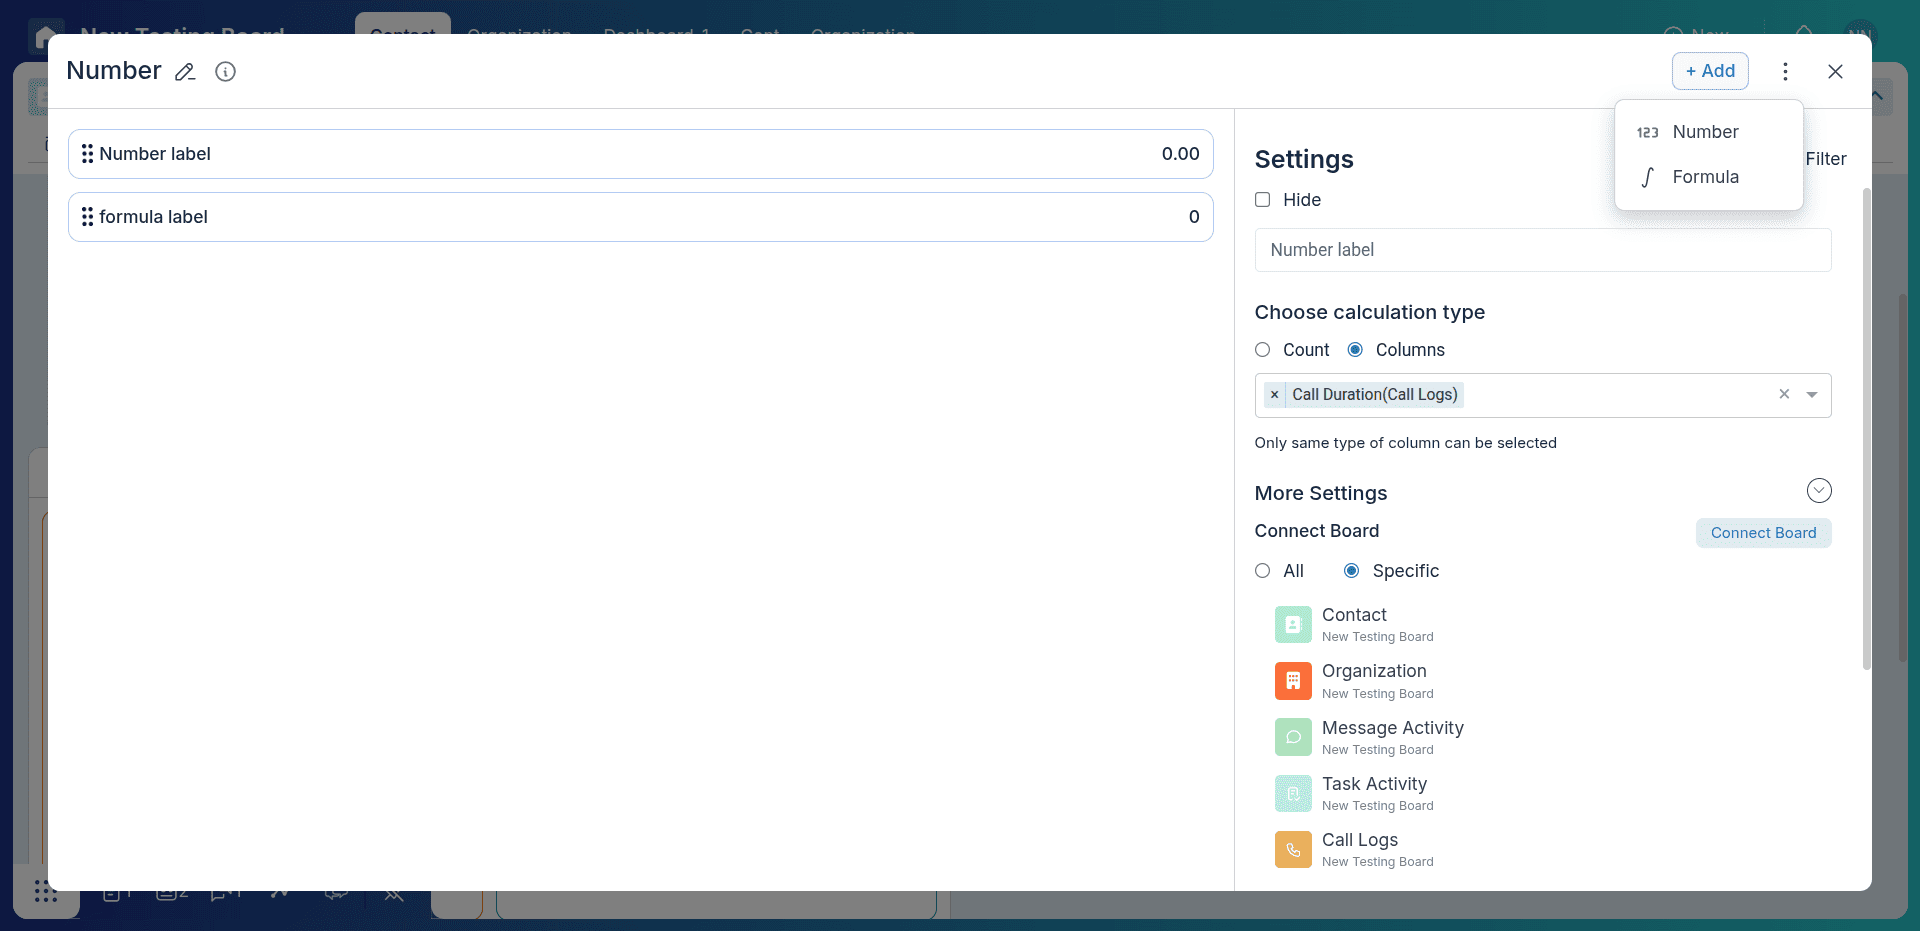
Hover over the number widget and click the settings icon to configure the widget.
- Hide: Click hide if you want to temporarily remove the widget from the chart without deleting it.
-
Choose Column Type:
- Select Count if you want to display the total number of records (for example, total leads).
- Select a numeric column if you want to apply operations such as Sum, Average, Minimum, or Maximum.
- Connect Board: Choose the board whose data you want to use for the widget.
- Unit: Add a unit such as %, $, or hrs and choose whether it appears on the left or right of the value.
- Filter: Apply filters to control which records are included in the metric (for example, show only leads created this month).
-
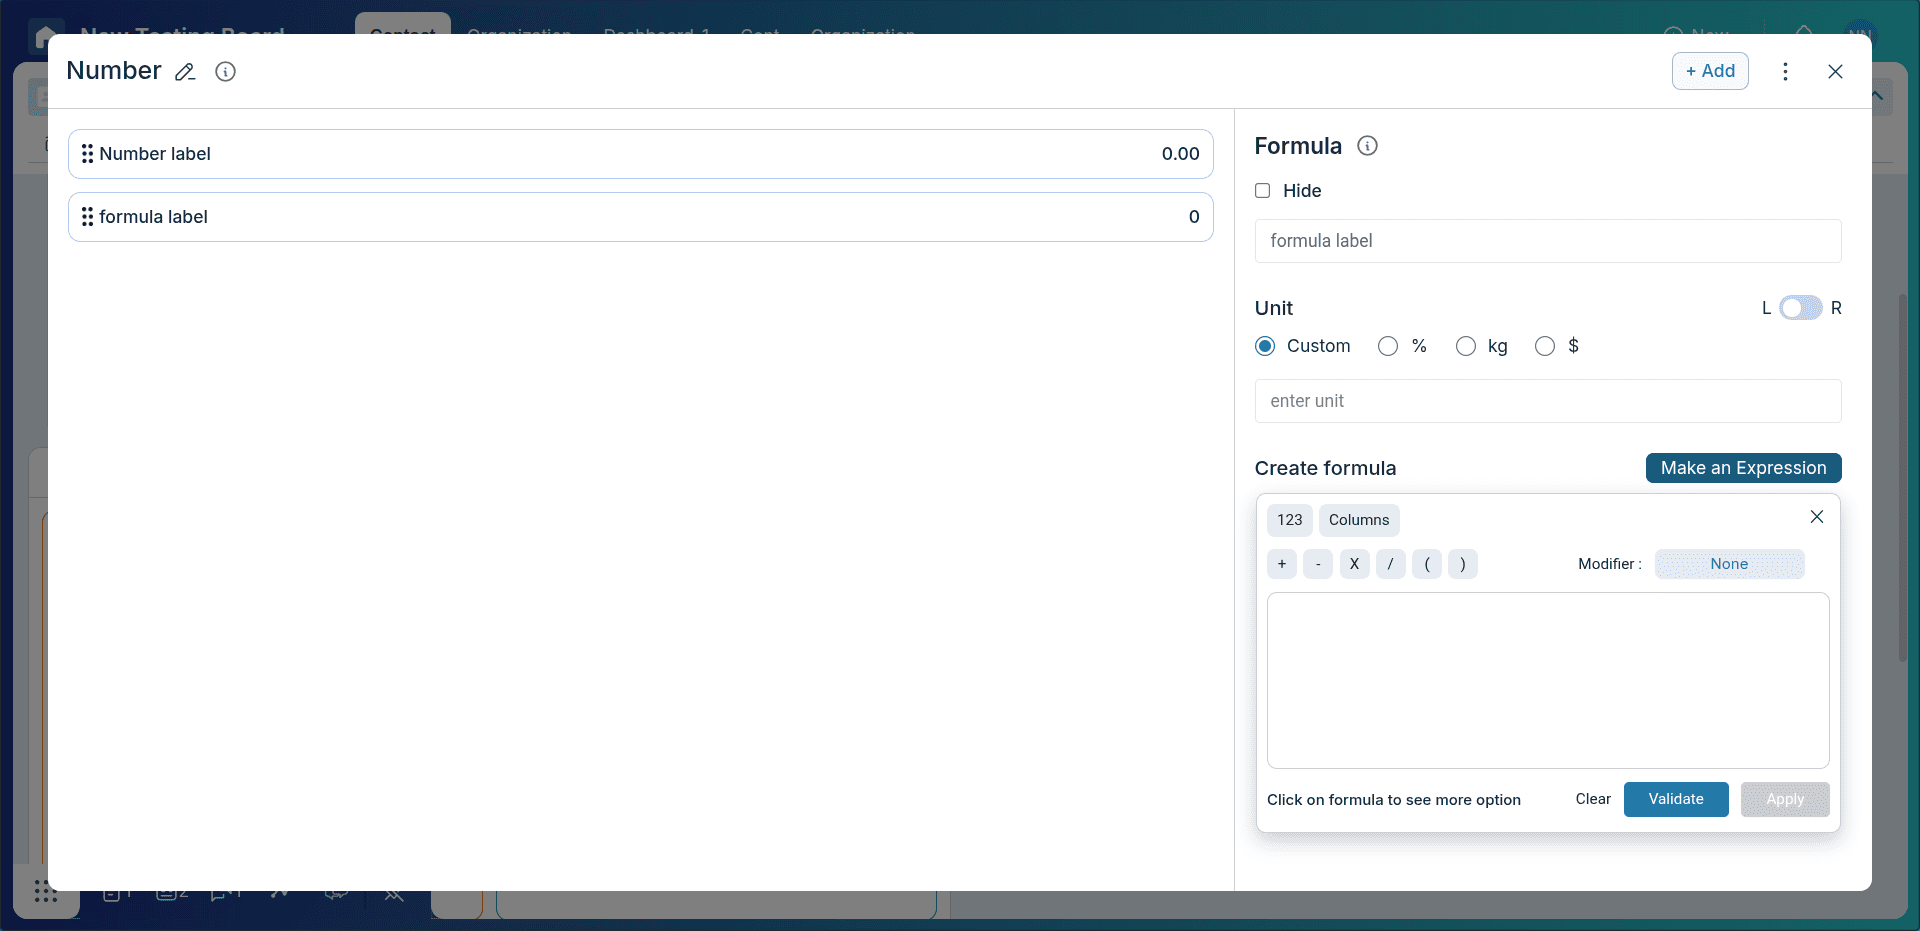
Using Formula for Calculations
Formula widgets allow you to perform calculations using other widgets or numeric columns.
Example:
- Total Leads: Count of all leads in the board.
- Closed Leads: Count of leads with status “Closed”.
- Conversion Rate: Closed Leads / Total Leads × 100
This helps you track key performance indicators directly from your dashboard.
-
Description (Optional)
You can add a description to explain what the metric represents. For example:
"Shows the total number of leads generated this month and the overall conversion rate."
-
Using Multiple Widgets for KPIs
You can combine multiple number widgets to create a quick KPI dashboard.
- Total Leads
- Total Closed Deals
- Conversion Rate
- Total Revenue
This helps managers quickly monitor important business metrics at a glance.
Conclusion
Great job! You've successfully created a number chart in Pronnel that brings your data to life. Whether you're tracking bugs, monitoring sales, or analyzing task distribution, these visual tools empower you to uncover insights faster and make smarter decisions. Keep exploring chart options to turn your data into meaningful stories and drive impactful outcomes!
Frequently Asked Questions About Number Charts in Pronnel
When should I use Number Charts?
Number charts are useful for displaying a single metric or calculated value, such as total leads, total closed deals, or conversion percentages. They help teams quickly monitor key business metrics at a glance.
Can I calculate values using existing data?
Yes. Use the Formula option to calculate values based on other number widgets or board columns. For example, you can calculate a conversion rate using the formula: Closed Leads / Total Leads × 100.
Can I combine multiple number widgets?
Yes. You can combine multiple number widgets to create a quick KPI dashboard. For example, display Total Leads, Total Closed Deals, Conversion Rate, and Total Revenue together to monitor key business metrics.
Can I export these charts?
Yes, you can export the dashboard containing the number chart as a Excel or Click on Screen Shot in widget three vertical dots.
Can I compare data from multiple boards?
Yes, after connecting boards to the dashboard. Add widgets per board to compare side by side.